A recent study investigated disturbances that preserved in the upper 260 m of a 723-m deep core drilled on the crest of a thrust-cored anticline in the western Qaidam Basin, NE Tibet.
1. Key Points:
• We interpret micro-faults, soft-sediment deformation, slumps, and detachment surfaces as paleoearthquake/tectonic indicators
• The core records five seismite clusters between 3.6 and 2.7 Ma, revealing episodic thrusting in relation to intense regional deformation
• During the clusters, regional deformation was concentrated more in the fold-and-thrust system than along regional major strike-slip faults
2. Overview
Significance and background:
Folding, a type of distributed deformation in the brittle field that is widespread in thrust-and-fold belts and accretionary prisms, is an important mode of deformation that is largely overlooked in earthquake physics and crustal dynamics. The western Qaidam Basin, NE Tibet contains numerous NW-SE-trending thrusts that extend over a distance of ~300 km along the Altyn Tagh Fault and north of the Kunlun Range. These thrusts-folds are the most prominent morphological feature in the western Qaidam Basin, NE Tibet, and have played a key role in the Miocene-Quaternary uplift of the region. However, little is known about the long-term seismo-tectonic evolution of this active thrust zone due to the absence of an extended paleoseismic record. Our understanding of earthquake history is still limited by short seismological and historical records. A continuous lacustrine sedimentary sequence (~33-1.6 Ma) accumulated in the Qaidam paleolake which may have sequentially recorded the development and activities of the underlying folds and thrusts.
Observations and interpretations:
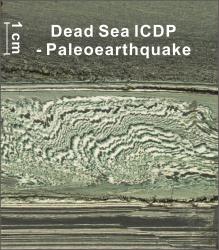
We present a unique record of disturbance spanning 2-Myr based on a deep core drilled on the crest of one such fold in the western Qaidam Basin. The disturbances comprise micro-faults, soft-sediment deformation, slumps, and detachment surfaces. We interpret the four types of disturbance as paleoearthquake/tectonic indicators. The core records five seismite clusters which occurred at 3.6-3.5 Ma, 3.4-3.2 Ma, 3.15-3.1 Ma, 3.0-2.9 Ma, and 2.8-2.75 Ma. This suggests the rate of tectonic strain accommodated by the folds and thrusts in the region varies and thus reveals episodic local deformation. During the clusters, regional deformation is concentrated more in the fold-and-thrust system than along regional major strike-slip faults.
Figures:
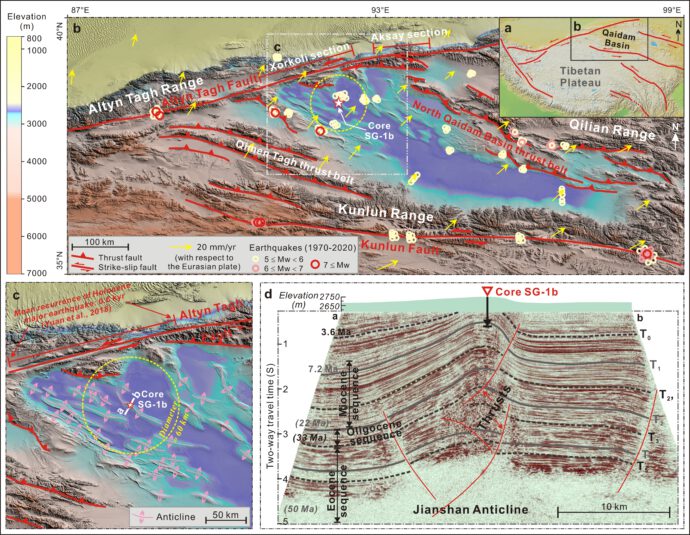
Fig. 1. Geological setting of the study area. (a) Location of Qaidam Basin and major faults on the Tibetan Plateau. (b) Active faults and GPS velocity in the region; circles represent earthquakes during the years 1970-2020 (http://ds.iris.edu/ds/). (c) Anticlines surrounding Core SG-1b. (d) Seismic profile (line a-b in Fig. 1c) across the Jianshan Anticline.
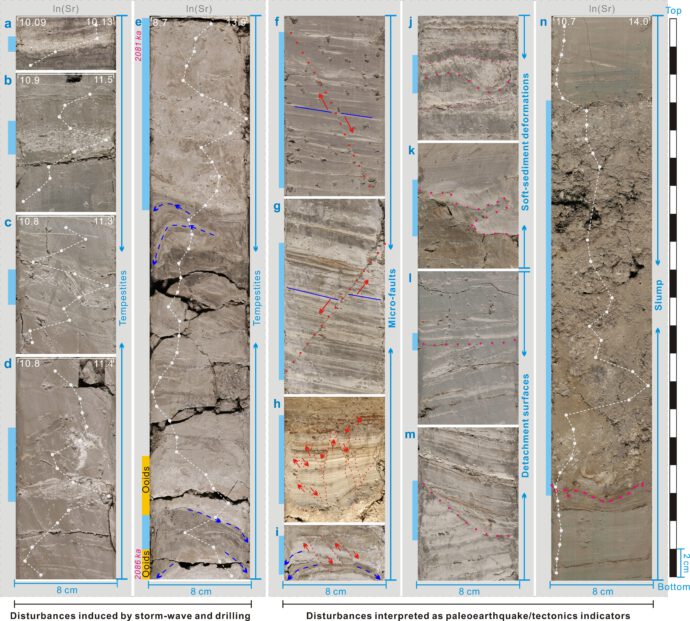
Fig. 2. The various types of disturbances in Core SG-1b. The light blue bars indicate the position of events; the white dashed lines and points represent XRF data. (a-e) Disturbances induced by storm-waves and drilling. Note the blue dashed lines in (e) and (i) indicate artificial disturbances (deformation). (f-n) Disturbances are interpreted as paleoearthquake/tectonic indicators. (f-g) Normal faults; the blue lines indicate the correlated marker layers. (h-i) Fault-graded beds; the red dashed lines indicate the positions of the slip plane, while the red arrows indicate slip directions. (j-k) Soft-sediment deformations. (l-m) Detachment surfaces. (n) Slump layer; the pink dashed line indicates the erosive base.
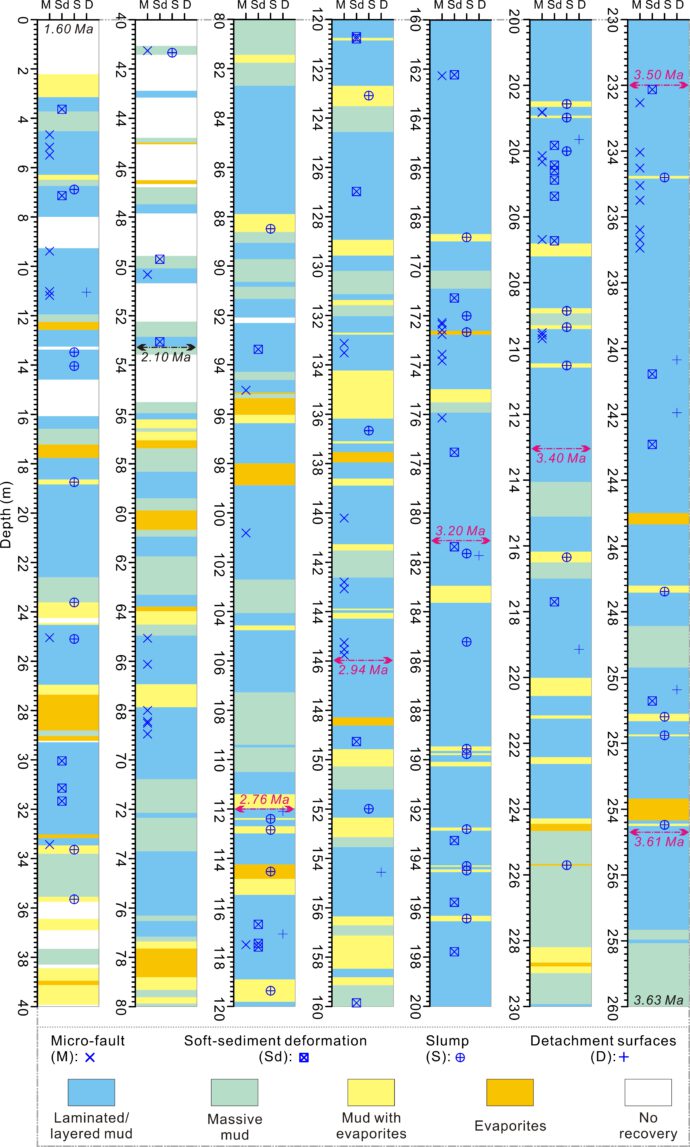
Fig. 3. Distribution of Type III-VI disturbances in 260-0 m of Core SG-1b (3.6-1.6 Ma). Micro-faults, soft-sediment deformation, and detachment surfaces have mainly occurred within the core intervals of laminations and layered mud. The coring rate in the upper 56 m is relatively low (~70%).
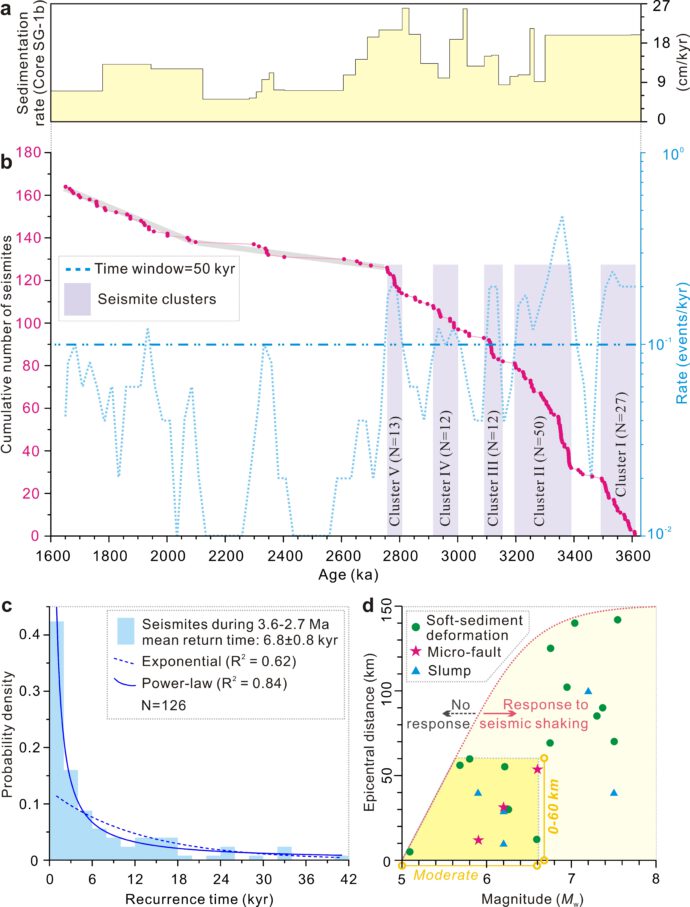
Fig. 4. Distribution of seismites during 3.6-1.6 Ma. (a) Sedimentation rate during 3.6-1.6 Ma. (b) Cumulative (red dots) and seismites rate (light blue) over the time interval of the seismite record. (c) Histograms for recurrence times of events during 3.6-2.7 Ma. Exponential and power-law distributions are plotted for comparison. (d) Instrumental and historical earthquake magnitude v.s. epicentral distance plot based on literature to show thresholds for micro-faults (Monecke et al., 2004; Avşar et al., 2016), soft-sediment deformation (Sims, 1973; Agnon et al., 2006; Moernaut et al., 2014; Avşar et al., 2016) and slumps (Piper et al., 1988; Shilts and Clague, 1992; Schnellmann et al., 2002; Becker et al., 2005; Wilhelm et al., 2016) in subaqueous environments in different regions. The yellow-colored area highlights the seismic effects of moderate earthquakes with epicentral distance ≤ 60 km.
3. More details can be found at:
(Open Access) https://agupubs.onlinelibrary.wiley.com/doi/full/10.1029/2020GL090530
https://www.researchgate.net/profile/Yin_Lu22

No Comments
No comments yet.