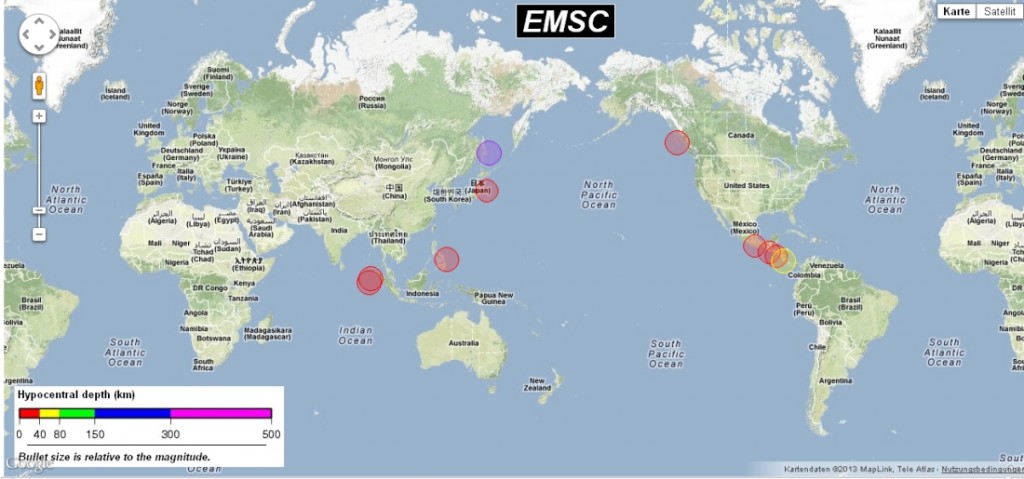
Last year we’ve seen some surprising seismic events. Do you remember the two strange events of M8.6 and M8.2 off Sumatra? We didn’t even know that such strong strike-slip events were possible, and those two earthquakes ruptured in a weird rectangular pattern AND occured within few minutes of each other. Do you remember the third most powerful EQ that rattled the Okhotsk Sea? No? Well, I think it’s a good idea to have a look at the strongest events that happened last year.
The 10 strongest events 2012
The following list is based on EMSC data, magnitudes may vary from USGS information:
Magnitude Depth Date Location
- Mw 8.4, 10 km, 2012-04-11, Sumatra
- Mw 8.0, 10 km, 2012-04-11, Sumatra
- Mw 7.7, 611 km, 2012-08-14, Sea of Okhotsk
- Mw 7.7, 10 km, 2012-10-28, Queen Charlotte Islands
- Mw 7.6, 20 km, 2012-08-31, Philippine Islands
- Mw 7.6, 40 km, 2012-09-05, Costa Rica
- Mw 7.4, 19 km, 2012-03-20, Mexico
- Mw 7.4, 25 km, 2012-08-27, El Salvador
- Mw 7.3, 30 km, 2012-11-07 , Guatemala
- Mw 7.3, 30 km, 2012-12-07, Honshu, Japan
From the 10 strongest earthquakes, 9 occured in relatively small depths of less than 40 km. Only one event was very deep (> 600 km).
Here’s the EMSC earthquake map:
Luckily, only relatively few people (768) died from earthquakes last year, which made 2012 really an exceptional one. The last years looked much worse:
Year fatalities (main event)
- 2011: 21,953 (Japan: 20,896 deaths)
- 2010: 320,120 (Haiti: 316,000 deaths)
- 2009: 1,790 (Indonesia: 1,117 deaths)
- 2008: 88,011 (China: 87,587 deaths)
- 2007: 712 (Peru: 514 deaths)
- 2006: 6,605 (Indonesia: 5,749 deaths)
- 2005: 88,003 (Pakistan: 80,361 deaths)
- 2004: 228,802 (Indonesia: 227,898 deaths)
- 2003: 33,819 (Iran: 31,000 deaths)
- 2002: 1,685 (Afghanistan: 1,000 deaths)
- 2001: 21,357 (India: 20,023 deaths)
From this table we learn that in most cases it’s one single event that accounts for the majority of victims. The “background” mortality due to “normal” earthquakes (let’s say, no exceptional events) is more or less the same (few hundreds) every year. The deadliest event in 2012 was a medium EQ in Iran on 11 August with more than 300 fatalities. Only 8 earthquakes in 2012 left more than 10 people dead.
The 10 deadliest events 2012
Data from USGS
Fatalities Magnitude Depth Date Location
- 306, Mw 6.4, 10 km, 2012-08-11, Iran
- 139, Mw 7.4, 19 km, 2012-03-20, Mexico
- 113, Mw 6.7, 20 km, 2012-02-06, Philippines
- 81, Mw 5.6, 10 km, 2012-09-10, China
- 75, Mw 5.7, 15 km, 2012-06-11, Afghanistan
- 38, Mw 6.8, 10 km, 2012-11-11, Myanmar
- 27, Mw 6.1, 10 km, 2012-05-20, Italy
- 10, Mw 8.4, 10 km, 2012-04-11, Sumatra
- 6, Mw 6.3, 10 km, 2012-08-18, Sulawesi
- 4, Mw 5.5, 10 km, 2012-06-24, China
What do we learn? Nothing new, but what we should already know:
- It’s not the high magnitude number that kills.
- It’s always the shallow events.
- It’s the bad building standards.
- If we want to save lifes, we need to make people wealthier.
An interesting thing is that of those ten most deadly events, three events were actually double events – two quakes within a short time span, making already weakened buildings collapse (events 1, 5 and 7).
This is what the USGS death map looks like:

USGS death-by-earthquakes-map, source: USGS
Let’s hope for a seismically quiet 2013.


Tim | 2013-01-10|16:34 (UTC)
Well copied from USGS 😉
Christoph Grützner | 2013-01-11|08:15 (UTC)
True. (And from EMSC.) I really wish the Germans had such an open access data policy like the USGS has. They are still allowed to keep their files closed, despite they are paid by the public.