A few weeks ago, Nadine Reitman (USGS) published an interesting paper about the use of Photogrammetry for Paleoseismic Trenching in BSSA. In this guest blog she shares her key findings and explains how to minimise errors without spending too much time measuring control points. Thanks Nadine!
Structure-from-motion (SfM) is now routinely used to construct orthophotos and high-resolution, 3D topographic models of geologic field sites. Here, we turn SfM on its side and use it to construct photomosaics and 3D models of paleoseismic trench exposures. Our results include a workflow for the semi-automated creation of seamless, high resolution photomosaics designed for rapid implementation in a field setting and a new error analysis of SfM models.
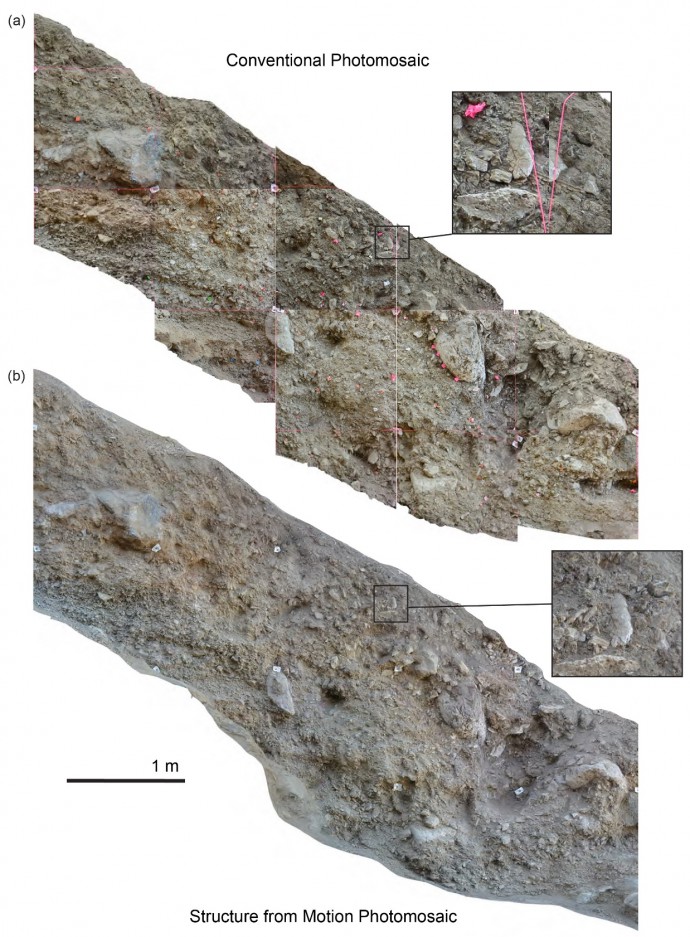
Photomosaics are an integral part of every trench study, commonly used as base maps for logging the structure and stratigraphy exposed in trench walls; however, they are incredibly time-consuming to do by hand, distracting scientists from valuable time in an open trench. Furthermore, manual photomosaics (Fig. 1a) can be inaccurate and ugly, with discontinuities and distortion at photo edges and incorrect representation of three-dimensional features such as holes and protruding clasts.
Figure 1: Comparison of photomosaics generated using (a) manual processing and tiling of individual images in image-editing software (e.g. Adobe Photoshop) and (b) SfM methodology using automated software (Agisoft PhotoScan).
After a large trench on the Wasatch Front in 2013, and with more trenching planned for the following summer, my colleagues and I were looking for a faster and less user-involved method of making photomosaics that would also improve visual continuity and accuracy. We wanted to know: How quickly can we construct photomosaics in the field that will still hold up to the demanding standards of the paleoseismic community?
Our new method takes approximately half the total time and less than 20% of the user input time as compared to manual methods. The resulting photomosaics are more accurate and visually continuous, and lack the distortion and artifacts common to manual mosaics (Fig. 1b). We share the detailed workflow as an electronic supplement to our BSSA paper.
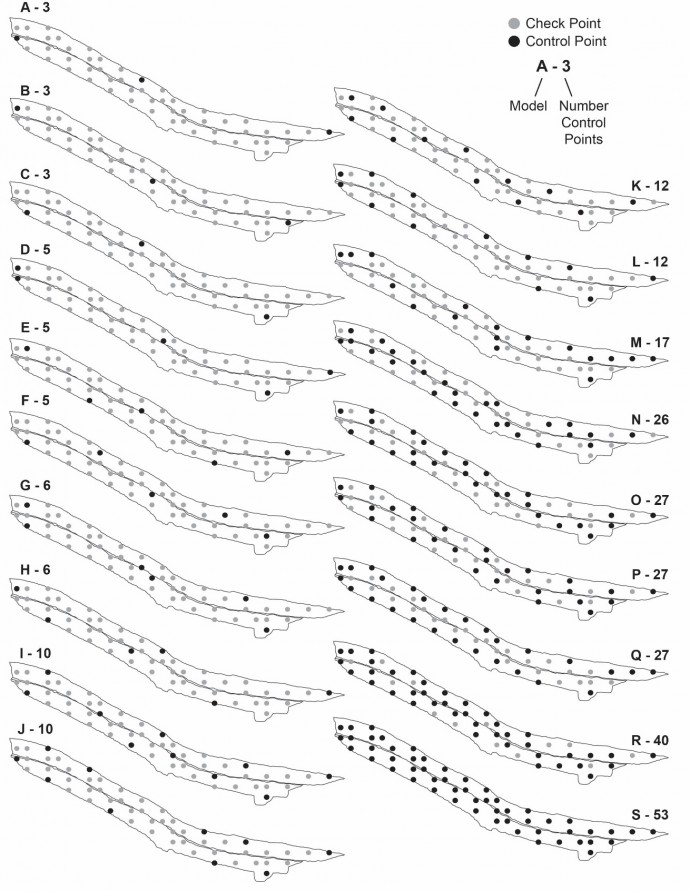
Figure 2: Schematic trench walls illustrating the distribution of control points and check points for each point cloud optimization.
In an error analysis, we evaluate the amount and distribution of control points required to make highly accurate models from sparse point clouds and answer fundamental questions like “How many control points do we really need?” (12-15), “Can I choose control points based on the ones I can reach while sitting in the shade?”(no), and “How important is it to hold the GPS level while measuring this location?” (very important).
We measured over 50 control points in each trench wall, and then iterated point cloud optimization with various configurations of control points (Fig. 2), using the remaining points as check points to test accuracy.
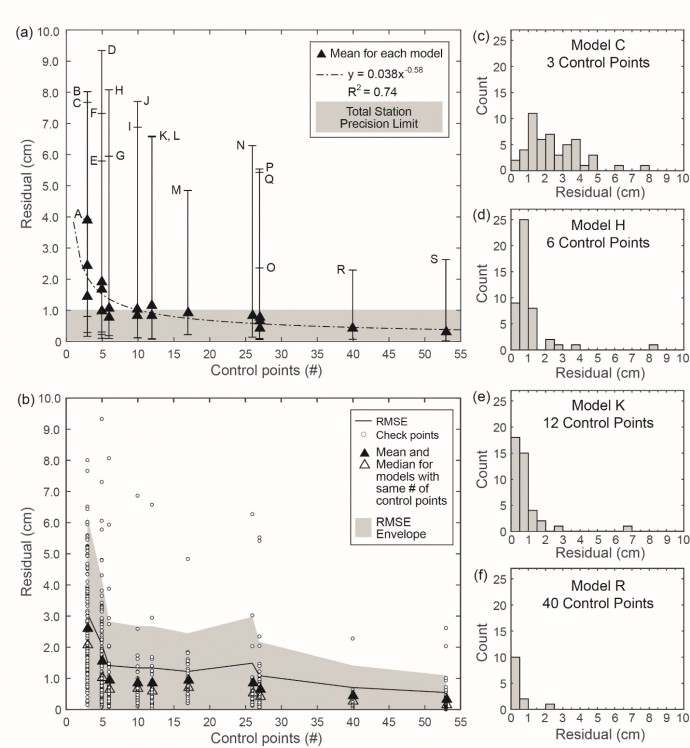
Figure 3: Error analysis. (a) 3D residuals of check points used in error analysis. Labels A-S indicate models with different quantities and distributions of control points, as illustrated in Fig. 2. (b) Root mean square error analysis. (c-f) Histograms showing the distribution of check point residuals for four models.
Results of the error analysis (Fig. 3) are widely applicable across disciplines, not just limited to paleoseismic trenches. From the error analysis we observe that:
- Spreading control points throughout study area results in higher accuracy. We constructed models with the same number of control points and varied their spatial distributions to be either throughout the study area or at the edges of the study area. Models with control points throughout the target area are more accurate.
- Using more control points increases accuracy, with diminishing returns. Accuracy increases as we use more control points in the model; however, after ~12 control points, the increase in accuracy is very small and should be weighed against the time required to make, measure, and input extra control points.
- Error at individual control points has a large effect on model accuracy. A few points measured incorrectly may cause large errors if used as control points.
- Surprisingly accurate models can be constructed with very few control points. Models with only 3-6 control points are accurate to within a few centimeters, but the spread of the residuals is much larger.
- Accuracy is limited by instrument measurement limits. We reach maximum accuracy at ~ 1 cm, which is also the precision limit of the total station used to measure control point locations.
Given the ease and speed of constructing mosaics using SfM, and the accuracy and detail of the final product, we advocate that SfM photomosaics, or a similar approach, become standard practice for future paleoseismic studies. Furthermore, the time saved allows geologists more time for important field work activities, like digging holes and drinking beer.
Feel free to contact me with questions, comments, or suggestions. I’m always interested in learning and exploring new ideas. For more photogrammetry in paleoseismology, check out our session at SSA 2016 in Reno, Nevada: Advances in Earthquake Science from Digital Photogrammetric Methods.
Reference:
- Reitman, N. G., Bennett, S. E., Gold, R. D., Briggs, R. W., & DuRoss, C. B. (2015). High‐Resolution Trench Photomosaics from Image‐Based Modeling: Workflow and Error Analysis. Bulletin of the Seismological Society of America. (Supplementary Material here)


No Comments
No comments yet.