Last Friday the RAS held a discussion meeting on Tectonics from Above: Recent Advances in the Use of High-resolution Topography and Imagery in London. Almost the entire Cambridge Tectonics Group went there and I absolutely enjoyed the meeting and the discussion with friends and colleagues mainly from the UK and from France. The speakers reported on open-source software for producing high-res DEMs, advances in aerial and satellite imagery, new techniques in remote sensing, and latest developments in fault/offset mapping. The meeting was supported by NERC, COMET+ and LICS.
Sebastien Leprince from Caltech started with a talk on sub-pixel correlation: Tracking 3D ground changes using multi-temporal stereo satellite imagery. The COSI-Corr software he develops is free for academic use, you can access it here: http://www.tectonics.caltech.edu/slip_history/spot_coseis/index.html. The software allows producing high-res deformation maps from pre- and post-event satellite imagery, but its use is not restricted to tectonics and (coseismic) deformation during large earthquakes, it also good for monitoring sand dunes, mass movements, etc.
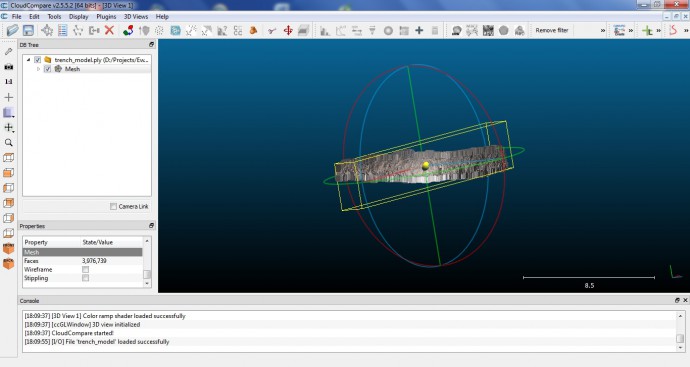
Dimitri Lague from the University of Rennes then showed the advantages of using point clouds instead of raster data for some applications: Benefits of working directly with raw 3D point clouds in the context of tectonic geomorphology. The algorithms he presented are included in the free open software package CloudCompare, which is a powerful tool to analyze LiDAR data and other point clouds:
Unfortunately, Dimitri had to leave early and so there was not much time to talk to him during the lunch break.
Ed Nissen (Colorado School of Mines) then talked about Long-term and single-event earthquake behaviour mapped with individual and repeat lidar datasets and presented exciting data from Japan. Check out his 2014 EPSL paper here. He showed how repeated LiDAR measurements can be used to map fault slip in areas where you don’t see much with other techniques and addressed some important points on the puzzling problem of surface offsets vs. offset at depth. Have a look at pointclouds.org for open point cloud library (PCL) software.
The final talk of the first session was held by Thomas Fritz (German Aerospace Centre, DLR). He explained the current state of the TanDEM-X project: High resolution global DEM data from the TanDEM-X radar mission. Good news is that the data will be available soon – much better resolution than SRTM, much better accuracy. Researchers need to submit a proposal to get access (and they need to pass German bureaucracy), commercial users can already buy some datasets. The full dataset will be processed until the end of next year, hopefully, and as always the most interesting parts (Himalayas etc.) are the most tricky ones and will be available last…
After lunch, Yann Klinger (IPGP) presented his work on Optical image correlation: topography and deformation at high resolution using the Mic-Mac open-source package. Make sure to check MicMac, the free image correlation software project here: http://logiciels.ign.fr/?-micmac,3-. It’s in French, but easy to understand. Great stuff, I especially liked what Yann had to say about surface offsets from the M7.7 Balochistan 2013 earthquake.
Jean-Philippe Avouac (was at Caltech, is now in Cambridge) then reported on a whole bunch of work he and his group have done on Fault dynamics and earthquake physics: learning from space observations. Jean-Philippe developed a lot of software tools for various different applications, it’s just too much to name them all here. By the way, he’s currently looking for a technician to work on GPS networks. Here’s the job offer.
Steven Hosford from CNES talked about hot news from SPOT imagery – it’s not expensive anymore! “The ISIS Programme intends to optimise access to the Spot infrastructure by providing SPOT data at a preferential rate, with a view to facilitating European space scientific research.” (http://isis-cnes.fr/) Make sure to check whether you are eligible, it might cost not more than 1€/km²… The most recent imagery will be available during soon.
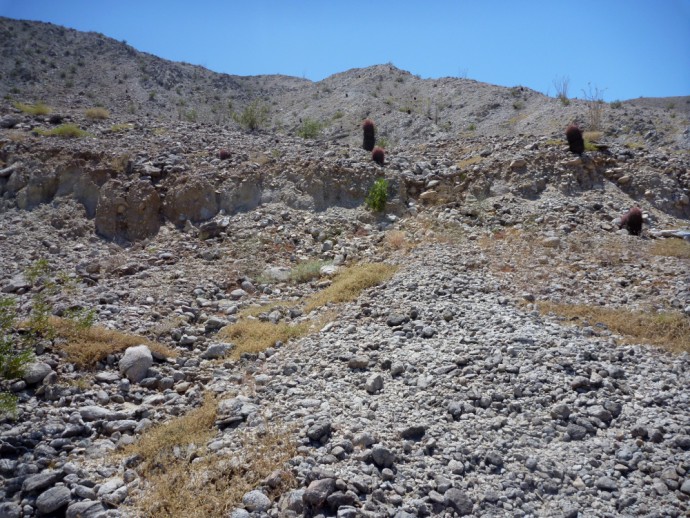
The El Mayor Cucapah earthquake was once again in the focus when Austin Elliott (was at UC Davis, now at Oxford) showed how fast (or slow?) fault scarps do erode: Rapid modification of fresh scarps along the 2010 Mw 7.2 El Mayor-Cucapah surface rupture measured by repeated terrestrial lidar scans. There’s an amazing dataset available for this quake: pre-and post-event LiDAR, t-LiDAR, aerial imagery, satellite imagery, balloon surveys, GPS, very detailed mapping, and paleoseismological trenches! Wonderful. Austin showed calculations based on repeated LiDAR surveys on how much degradation actually took place since the scarp was formed in 2010. He found that the slopes of larger stream have been least affected and he very nicely illustrated what a single heavy-rain event did to the free face in a stream…

El Mayor Cucapah surface rupture in 2012
Yu Zhou (University of Oxford) then reported on work he has done on the Balochistan earthquake – an area where field work is especially difficult: Measuring co-seismic vertical displacements with Pleiades stereo imagery. Yu used the very nice Pleiades imagery to map fault offsets and was clearly happy that he did not need to go to the field… Pleiades imagery has a really high resolution, worth checking out, and it’s not too expensive. The stereo-option is what makes this especially interesting.
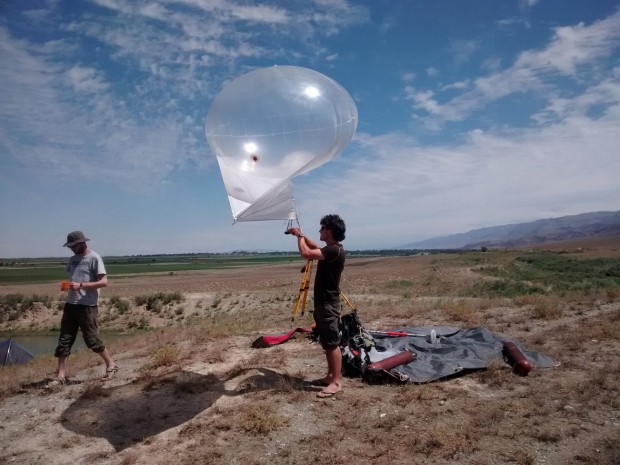
The last talk was held by David Mackenzie (University of Oxford) about Using Structure from Motion to map fault structure and geomorphology at all scales: a low cost alternative to terrestrial lidar. David likes helikites (and so do I) and he showed impressive examples from Turkey and Kazakhstan. Buy a helikite, some party helium, a cheap digital compact camera, and 120 m fishing line – off you go! It’s possible to map several kilometers of fault scarps per day, but of course data processing with software like AGIsoft is a bit more time-consuming. The resolution of the DEM computed from the orthophotos is in the cm-range, plus you have the imagery! Works fine on small scales (like a paleoseismological trench) as well. Maybe this is the cheapest way to get a high-res DEM.

The helikite carrying the camera. David (right) for scale: balloon has ~1.2 m³.
As you can see this was a great day in London – thanks to the organizers Richard Walker, Barry Parsons, and James Hollingsworth, to the RAS and to all speakers!
Some tweets can be found under the hashtag #RASTectonics.


No Comments
No comments yet.